Hormones
The Perimenopause Blood Tests Your Doctor Probably Isn't Running
5 May 2026 · By Dr. B.J. Huber · 13 min read
Your blood work comes back normal, your doctor says. Everything within range. But you’re sleeping badly, permanently exhausted, your head is clouded with brain fog, and you’re gaining weight even though nothing about your diet has changed. Sound familiar?
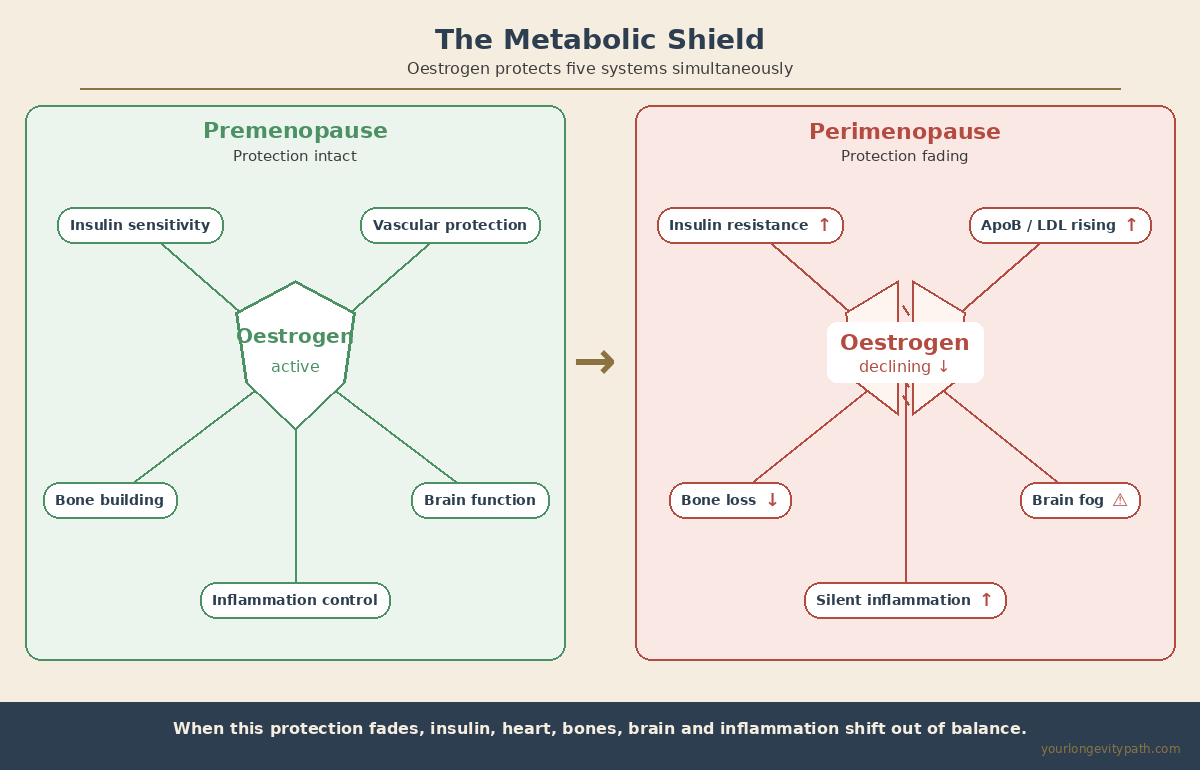
The problem is rarely that nothing gets tested. It’s what gets tested. During perimenopause, your body loses its metabolic shield: oestrogen. It regulates insulin sensitivity, inflammation control, thyroid function, lipid metabolism and bone building all at once. When this protection fades, several systems shift out of balance simultaneously. But the standard blood panel most women receive doesn’t capture any of it.
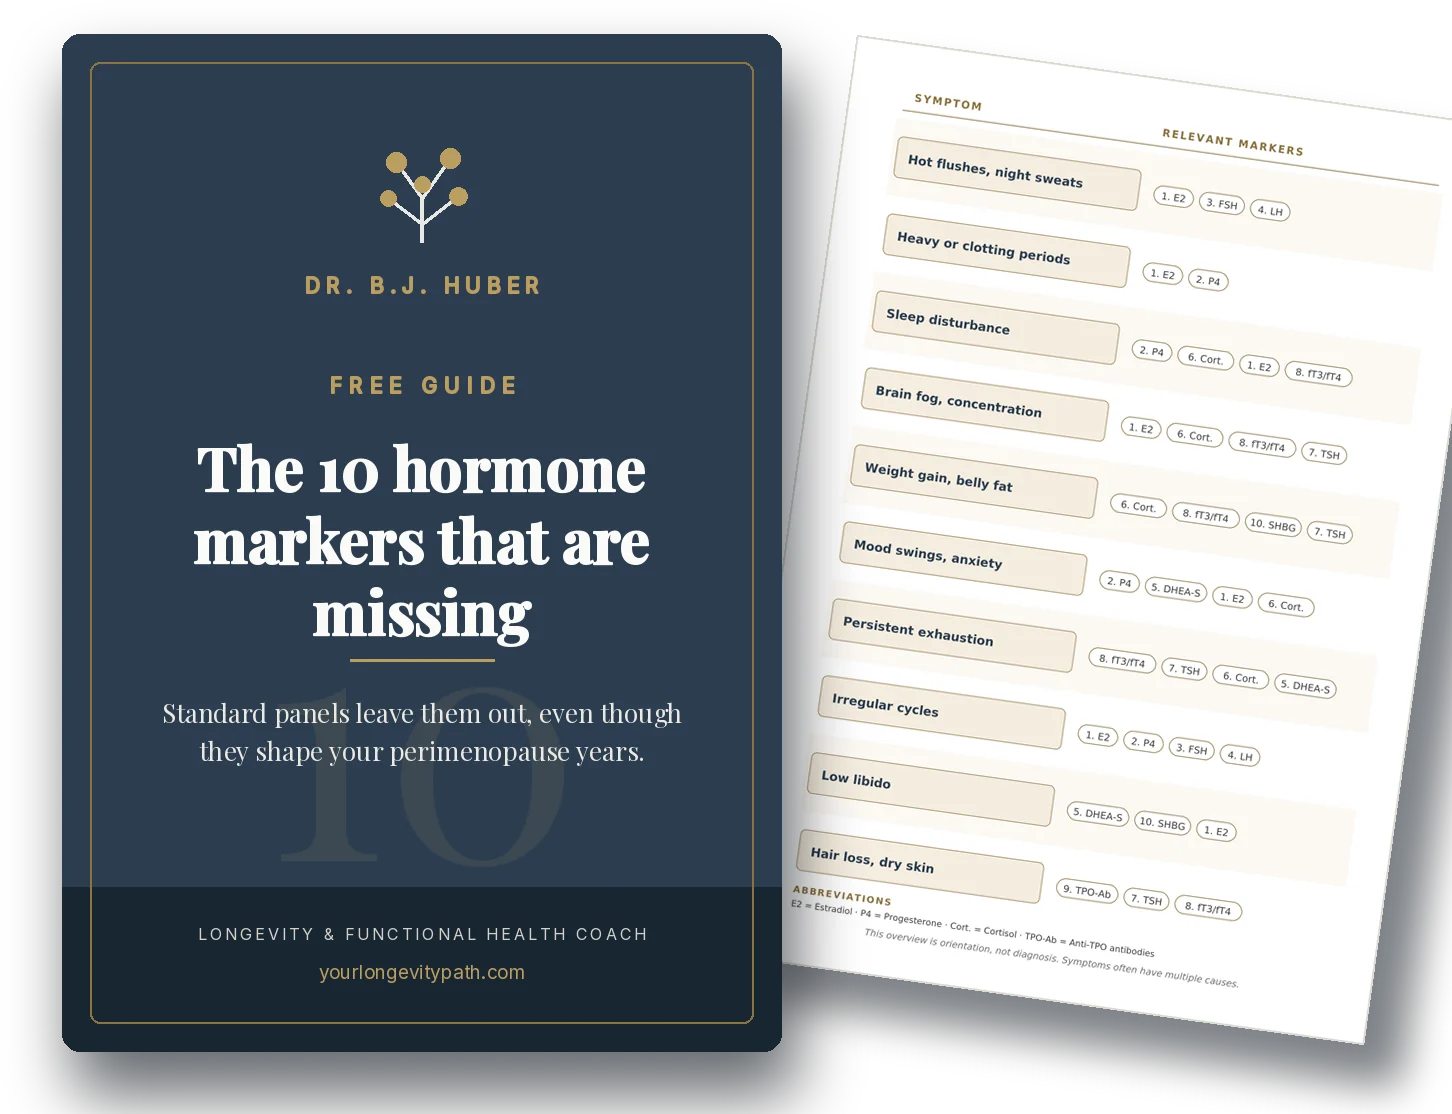
- A standard hormone panel (FSH, estradiol) captures only a fraction of the metabolic changes in perimenopause. Fasting insulin, ApoB, hs-CRP and free T3 are often more informative.
- Postmenopausal women show 42% higher postprandial glucose spikes and less favourable CGM profiles than premenopausal women (ZOE PREDICT study, n = 1,002).
- “Normal range” means statistically unremarkable, not optimal. A ferritin of 15 ng/mL counts as normal but sits far below the functional optimum of 50–100 ng/mL.
Why isn’t a standard blood panel enough in perimenopause?
A standard hormone panel tests FSH and estradiol. But these values fluctuate so dramatically during perimenopause that a single measurement says very little. At the same time, this panel misses the metabolic, inflammatory and endocrine shifts that often underlie the symptoms.
FSH and estradiol confirm that you’re in hormonal transition. Nothing more. An FSH above 25 IU/L on cycle day 2–5 can support the diagnosis of ovarian transition, but the value swings considerably from month to month. Estradiol can be low, normal or even surging high during perimenopause (Prior, 2023).
What this panel doesn’t show: whether your insulin metabolism is shifting, whether ApoB-carrying lipoproteins are damaging your arteries, whether your thyroid is contributing to the symptoms, whether silent inflammation is already raising your cardiovascular risk, whether your iron stores explain the exhaustion. Yet these are exactly the areas where perimenopause presents the greatest opportunities for intervention.
The reason is systemic, not personal. Conventional medicine is designed to detect disease, not to optimise function. Reference ranges show what’s common in a population, not what’s optimal for you. The result: you feel terrible, your doctor says “all normal”, and you start wondering if it’s all in your head. It isn’t. It’s in the panel.
Which lab values reveal metabolic dysfunction?
Fasting insulin and HbA1c detect insulin resistance years before fasting glucose becomes abnormal. During perimenopause, the risk of insulin resistance rises because oestrogen directly modulates insulin sensitivity, and this protective effect fades as oestrogen drops.
The ZOE PREDICT study examined over 1,000 women with continuous glucose monitoring (CGM) and showed: postmenopausal women had 42% higher postprandial glucose spikes, 6% higher fasting glucose and 5% higher HbA1c than premenopausal women. They also showed less favourable CGM profiles (higher glycaemic variability, less time in range) and elevated inflammatory markers (Bermingham et al., 2022). That sounds abstract, but it measurably shifts the cardiovascular risk profile.
Recent SWAN data show that higher fasting insulin levels in early perimenopause are associated with earlier onset and longer duration of vasomotor symptoms, independent of BMI (Athar et al., 2026).
What to test:
- Fasting insulin: The earliest marker for insulin resistance. Functional optimal range: below 5–7 µIU/mL. Many labs only flag values above 25 µIU/mL.
- HbA1c: Long-term blood sugar over 2–3 months. Functionally optimal: 4.8–5.3%. The normal range extends to 5.7%, which from a longevity perspective is already too high.
- HOMA-IR: Calculated from fasting insulin and fasting glucose (insulin × glucose / 405 when glucose is in mg/dL; use 22.5 when glucose is in mmol/L). Below 1.0 is optimal; above 2.5 indicates clinical insulin resistance. Important: most labs don’t report this automatically. You can calculate it yourself.
Why does cardiovascular risk rise so sharply in perimenopause?
Oestrogen protects the vasculature through several mechanisms: it keeps LDL low, exerts anti-inflammatory effects on arterial walls, and promotes nitric oxide production (vasodilation). When this protection fades, LDL, ApoB and inflammatory markers spike within a few years.
The SWAN study documented that within a one-year window around the final menstrual period, total cholesterol, LDL and apolipoprotein B rise sharply (El Khoudary et al., 2019). Research presented at the ESC Congress 2024 showed that these changes begin during perimenopause itself, not only after menopause.
ApoB (apolipoprotein B) deserves special attention here. Every atherogenic lipoprotein particle (LDL, VLDL, Lp(a)) carries exactly one ApoB molecule. ApoB therefore measures the number of potentially harmful particles, not just their cholesterol content. In the Copenhagen General Population Study with roughly 95,000 participants (53,484 women and 41,624 men), elevated ApoB predicted cardiovascular risk independently of LDL cholesterol and non-HDL cholesterol (Johannesen et al., 2024). Testing only LDL gives you half the picture.
Ridker et al. (2024) examined in 27,939 women followed for up to 30 years the independent contributions of inflammation, cholesterol and lipoprotein(a) to cardiovascular risk. Each of the three markers (hs-CRP, LDL-C, Lp(a)) predicted events independently, most strongly in combination. That argues for an extended risk profile beyond LDL alone.
What to test:
- ApoB: The gold standard for atherosclerotic risk. Functionally optimal: below 80 mg/dL (below 60 mg/dL if risk factors are present). Rarely tested routinely, but available on request from most labs.
- hs-CRP: Marker for systemic inflammation. Functionally optimal: below 1.0 mg/L. Above 3.0 mg/L indicates elevated cardiovascular risk.
- Lp(a): Genetically determined, not modifiable, but important to know. Testing once in a lifetime is enough.
Why does the thyroid get overlooked so often in perimenopause?
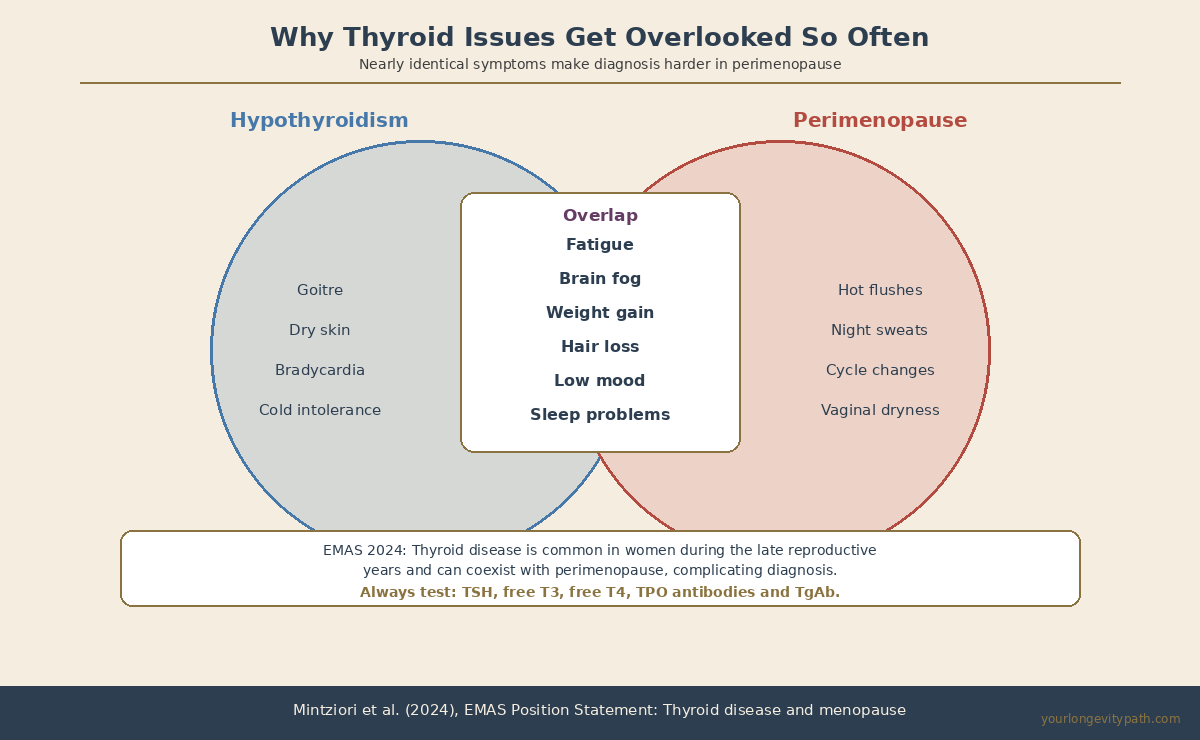
Hypothyroidism and perimenopause share nearly identical symptoms: fatigue, weight gain, brain fog, low mood, hair loss. A 2024 EMAS position statement emphasises that thyroid disease is common in women during the late reproductive years and can coexist with perimenopause, making diagnosis considerably harder (Mintziori et al., 2024).
The problem: most doctors test only TSH. But a normal TSH doesn’t rule out low free T3 (the active thyroid hormone). In the early stages of Hashimoto’s thyroiditis, the thyroid may still produce enough hormone to keep TSH within range, yet antibodies are already causing symptoms. For women over 40, the risk of autoimmune thyroiditis rises sharply — right in the window where perimenopause begins.
What to test:
- TSH: A screening parameter, but not sufficient on its own. Functionally optimal: 1.0–2.5 mIU/L.
- Free T3: The biologically active thyroid hormone. If T3 is low but TSH is normal, a conversion problem is likely.
- Free T4: The precursor to T3. Together with T3, it shows whether conversion is working.
- TPO antibodies and TgAb (thyroglobulin antibodies): Markers for Hashimoto’s thyroiditis. Some women are only positive for TgAb, so test both.
What do iron stores, vitamin D and silent inflammation reveal about your energy levels?
Ferritin shows iron stores, which are critically low in many women around 40 but often aren’t included in a standard panel. Vitamin D is a key marker for bone health, immune function and mood that gains particular importance during perimenopause.
During perimenopause, cycles can become shorter and heavier, depleting iron stores faster. A ferritin of 15 ng/mL is considered “normal” by lab standards but falls well below the functional optimum for energy production and cognitive performance. Soppi (2018) showed that iron deficiency without anaemia (normal haemoglobin but low ferritin) produces a distinct clinical picture: fatigue, concentration problems, sleep disturbance, hair loss.
What to test:
- Ferritin: Iron stores. Functionally optimal: 50–100 ng/mL. Below 30 ng/mL often explains fatigue and hair loss, even when haemoglobin is still normal.
- 25-OH Vitamin D: Functionally optimal: 40–60 ng/mL. Vitamin D deficiency during perimenopause raises the risk of insulin resistance, cardiovascular disease and depression (Mei et al., 2023).
- Homocysteine: Marker for silent inflammation and cardiovascular/cognitive risk. Closely linked to B12/folate metabolism. Functionally optimal: below 8 µmol/L. For how exactly inflammation travels from the gut to the brain and causes brain fog, read more here.
Which hormones should be tested beyond FSH and estradiol?
Progesterone often drops first in perimenopause, years before estradiol declines noticeably. This early progesterone fall explains sleep problems, anxiety and cycle changes that a standard FSH/estradiol panel simply cannot capture, yet their clinical impact is already considerable.
Prior (2023) describes that even with perfectly normal cycle length, progesterone levels in perimenopause are lower than they were premenopausally. Progesterone activates GABA receptors in the brain, acting as a natural sedative and anxiolytic. When it drops, sleep quality and emotional stability often fall in tandem. A shortened cycle (under 26 days) or a luteal phase under 10 days are frequently the earliest clinical signs. A Phase III randomised trial showed that 300 mg oral micronised progesterone significantly improved perimenopausal night sweats and sleep disturbance (Prior et al., 2023).
Testosterone declines continuously during perimenopause as the ovaries scale back production. This gradual drop explains the loss of muscle mass, drive and libido that many women notice from their early 40s but rarely connect to a hormone deficit.
SHBG (sex hormone-binding globulin) is an underestimated marker that captures insulin resistance and hormonal status simultaneously. Low SHBG is an independent risk factor for type 2 diabetes, particularly in postmenopausal women. The SWAN study showed that SHBG changes across the menopause transition predict diabetes risk (Hedderson et al., 2024).
What to test:
- Progesterone (luteal phase, day 19–21): Functionally optimal: above 10 ng/mL in the luteal phase. Serial measurements across 2–3 cycles are more informative than a single value.
- SHBG: Marker for insulin resistance and free testosterone. Low SHBG with high insulin points toward metabolic syndrome.
- Testosterone (total and free): Declines continuously during perimenopause. Affects muscle mass, drive, libido and bone density.
- DHEA-S: Marker for adrenal reserve and biological ageing.
Normal range is not optimal range
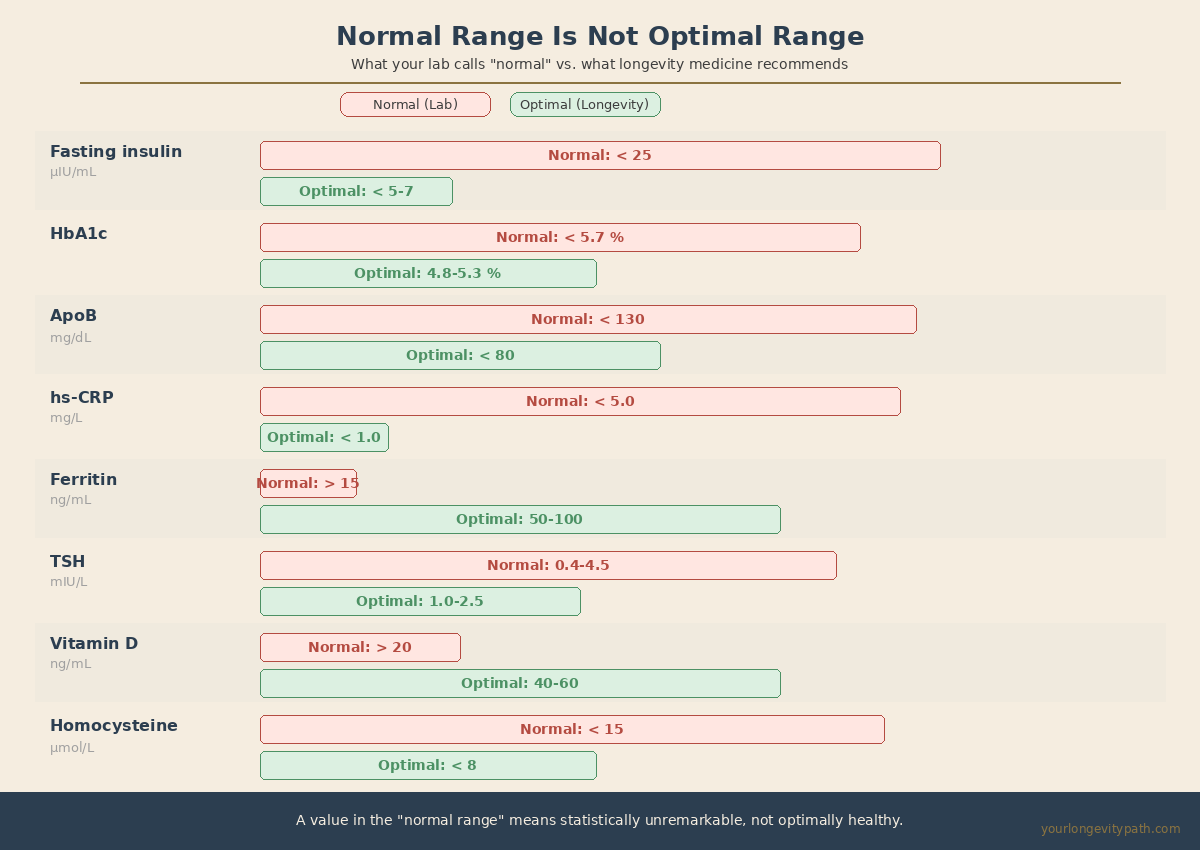
Reference ranges in laboratory medicine reflect the statistical distribution of a population. They show what’s common, not what’s healthy. This distinction matters particularly in perimenopause because your metabolism is in a transitional state: the values aren’t yet pathological, but the symptoms are real.
| Biomarker | "Normal" (Conventional) | Optimal (Longevity) | Why it matters |
|---|---|---|---|
| Fasting insulin | < 25 µIU/mL | < 5–7 µIU/mL | Earliest marker for metabolic ageing |
| HbA1c | < 5.7% | 4.8–5.3% | Long-term blood sugar, cardiovascular risk |
| ApoB | < 130 mg/dL | < 80 mg/dL | Gold standard vascular risk, more telling than LDL |
| hs-CRP | < 5.0 mg/L | < 1.0 mg/L | Marker for inflammageing and heart risk |
| Ferritin | > 15 ng/mL | 50–100 ng/mL | Below 30: energy, sleep and cognition suffer |
| TSH | 0.4–4.5 mIU/L | 1.0–2.5 mIU/L | Wellbeing vs. merely functioning |
| Vitamin D | > 20 ng/mL | 40–60 ng/mL | Bone, immune system, mood, insulin |
| Homocysteine | < 15 µmol/L | < 8 µmol/L | Silent inflammation, heart and brain risk |
If you only catch these changes once they’ve crossed into the pathological range, you’ve missed the most important window for intervention.
Your next step
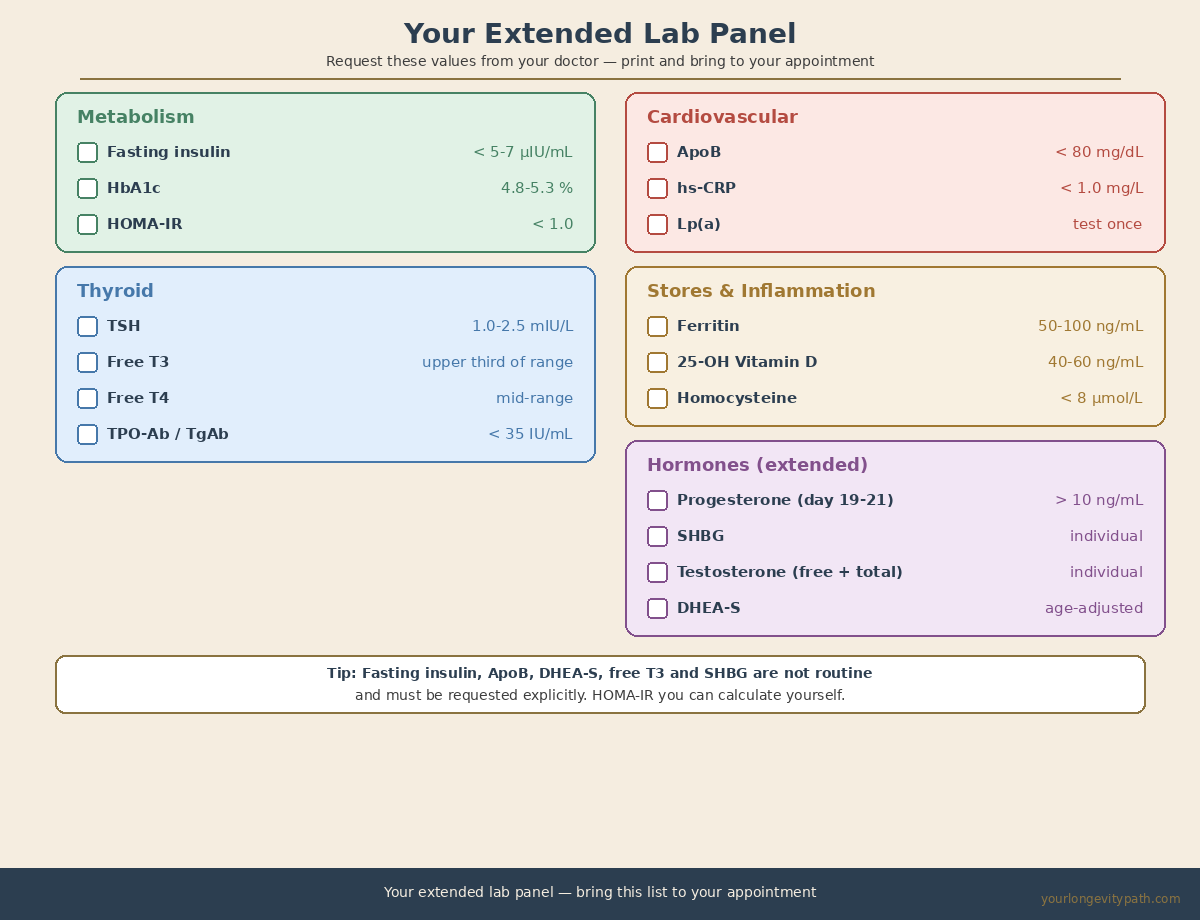
You can request these lab values from your GP. Some of them (fasting insulin, ApoB, DHEA-S, free T3, SHBG) aren’t routine and need to be asked for explicitly. Others (hs-CRP, ferritin, vitamin D) should be standard but are often left out. HOMA-IR you can calculate yourself from fasting insulin and fasting glucose.
The values alone are a starting point. What follows from them (which values to prioritise, where your individual optimum lies, which interventions offer the greatest impact for your profile) can’t be answered generically. That’s exactly what we cover in a free discovery call.
Scientific Sources
- El Khoudary, S.R. et al. (2019). The menopause transition and women’s health at midlife: a progress report from the Study of Women’s Health Across the Nation (SWAN). Menopause, 26(10), 1213–1227. doi: 10.1097/GME.0000000000001424
- Athar F, Gregory S, Houston EJ, Templeman NM. Insulin Levels Early in Perimenopause Inform Vasomotor Symptom Incidence Across the Menopausal Transition. J Clin Endocrinol Metab. 2026; dgaf699 (online ahead of print 3 Jan 2026). doi:10.1210/clinem/dgaf699 · PMID:41482729
- Bermingham, K.M. et al. (2022). Menopause is associated with postprandial metabolism, metabolic health and lifestyle: The ZOE PREDICT study. eBioMedicine, 85, 104303. doi: 10.1016/j.ebiom.2022.104303
- Prior, J.C. et al. (2023). Oral micronized progesterone for perimenopausal night sweats and hot flushes: a Phase III Canada-wide randomized placebo-controlled 4 month trial. Sci Rep, 13, 9082. doi: 10.1038/s41598-023-35826-w
- Ridker PM et al. Inflammation, Cholesterol, Lipoprotein(a), and 30-Year Cardiovascular Outcomes in Women. N Engl J Med. 2024;391(22):2087–2097. doi:10.1056/NEJMoa2405182
- Johannesen CDL, Langsted A, Nordestgaard BG, Mortensen MB. Excess Apolipoprotein B and Cardiovascular Risk in Women and Men. J Am Coll Cardiol. 2024;83(23):2262–2273. doi:10.1016/j.jacc.2024.03.423
- Hedderson MM, Capra A, Lee C, Habel LA, Lee J, Gold EB, Badon SE, Mitro SD, El Khoudary SR. Longitudinal Changes in Sex Hormone Binding Globulin (SHBG) and Risk of Incident Diabetes: SWAN. Diabetes Care. 2024;47(4):676–682. doi:10.2337/dc23-1630
- Mintziori, G. et al. (2024). EMAS position statement: Thyroid disease and menopause. Maturitas, 185, 107991. doi: 10.1016/j.maturitas.2024.107991
- Soppi, E.T. (2018). Iron Deficiency Without Anemia — A Clinical Challenge. Clin Case Rep, 6(6), 1082–1086. doi: 10.1002/ccr3.1529
- Mei Z, Hu H, Zou Y, Li D. The role of vitamin D in menopausal women’s health. Front Physiol. 2023;14:1211896. doi:10.3389/fphys.2023.1211896
- Park, J.M. & Lee, Y.J. (2020). Serum oestradiol levels are inversely associated with C-reactive protein levels in premenopausal women. J Int Med Res, 48(10). doi: 10.1177/0300060520961228
- Lumsden MA, Dekkers OM, Faubion SS et al. Clinical practice guideline for evaluation and management of menopause and the perimenopause. Eur J Endocrinol. 2025;193(4):G49–G81. doi:10.1093/ejendo/lvaf206
Which blood values change in perimenopause?
FSH rises, estradiol and progesterone fall. But fasting insulin, HbA1c, ApoB, hs-CRP, ferritin and thyroid markers shift too. These extended markers reveal metabolic and inflammatory changes that a standard hormone panel misses entirely.
What lab tests should I get in perimenopause?
Beyond FSH and estradiol: fasting insulin and HbA1c (insulin resistance), ApoB (cardiovascular risk), hs-CRP (silent inflammation), ferritin (iron stores), 25-OH vitamin D, free T3 and TSH (thyroid), luteal-phase progesterone, SHBG and DHEA-S.
Why does my doctor say 'all normal' when I feel terrible?
Reference ranges reflect the statistical middle of a population, not your individual optimum. Conventional medicine looks for disease, not dysfunction. A ferritin of 15 ng/mL is 'not anaemic' but demonstrably too low for energy production and cognition.
Which biomarkers show how fast I'm biologically ageing?
HbA1c, fasting insulin, ApoB, hs-CRP and vitamin D reveal cardiovascular and metabolic risk. These markers are especially relevant in perimenopause because oestrogen's protective effect on the heart, bones and brain is fading.
This article is for informational purposes only and does not replace professional medical advice, diagnosis, or treatment. If you have health concerns, please consult a qualified healthcare professional.